CODERS Solutions
Pharma Business Intelligence

Is your pharma business running on gut feel?

See your inventory, sales, and margins — live. Real-time dashboards built on Microsoft Power BI and Dynamics 365 Business Central. Designed for pharma distributors, importers, and wholesalers in Lebanon.

  • Batch & expiry tracking across every warehouse
  • Rep performance, targets, and margin by brand — in one place
  • Works with your existing ERP. Live in 4–6 weeks.
Microsoft
Microsoft Solutions Partner Data & AI · Business Applications
Since 1990 35+ years of ERP expertise
Built on Microsoft's Enterprise Cloud Enhanced with AI and tailored for pharma distribution.
Microsoft Copilot Copilot AI
Microsoft Power BI Power BI
Microsoft Power Apps Power Apps
Microsoft Dynamics 365 Business Central Business Central
What you get

One platform. Three views. Zero guesswork.

Every role in your pharma business gets exactly the view they need — from the warehouse floor to the CEO's phone.

For Operations

Live inventory control

Every SKU, every warehouse, every batch. See what's moving, what's stuck, and what's about to expire — before it hits the P&L.

  • Batch & expiry tracking
  • Automated stock-at-risk alerts
  • Warehouse-level breakdown
For Sales Teams

Sales rep performance

Know exactly who's selling what, where, and at what margin. Coach from data, not from Excel screenshots sent the night before the meeting.

  • Rep performance by brand & region
  • Target vs. actual, live
  • Automated commission tracking
For Owners & CEOs

Total business visibility

Revenue, margin, cash flow, top movers — on one screen. Open it on your phone between meetings and know exactly where the business stands.

  • Margin by brand, channel, rep
  • AI insights via Microsoft Copilot
  • Mobile-first, anywhere access
The dashboard

What your Monday morning looks like.

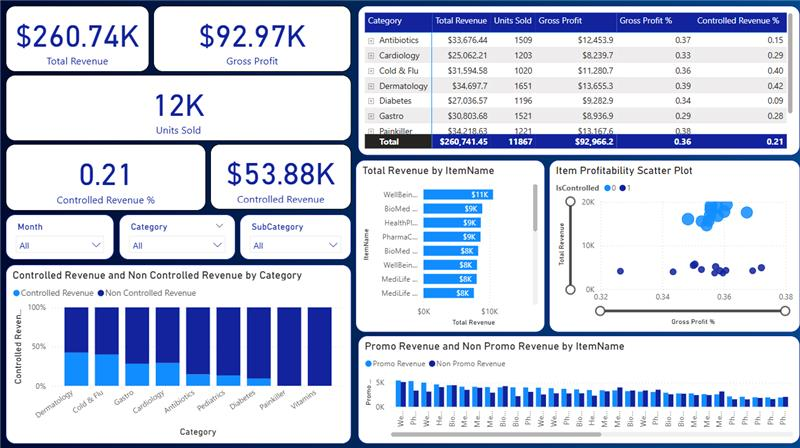
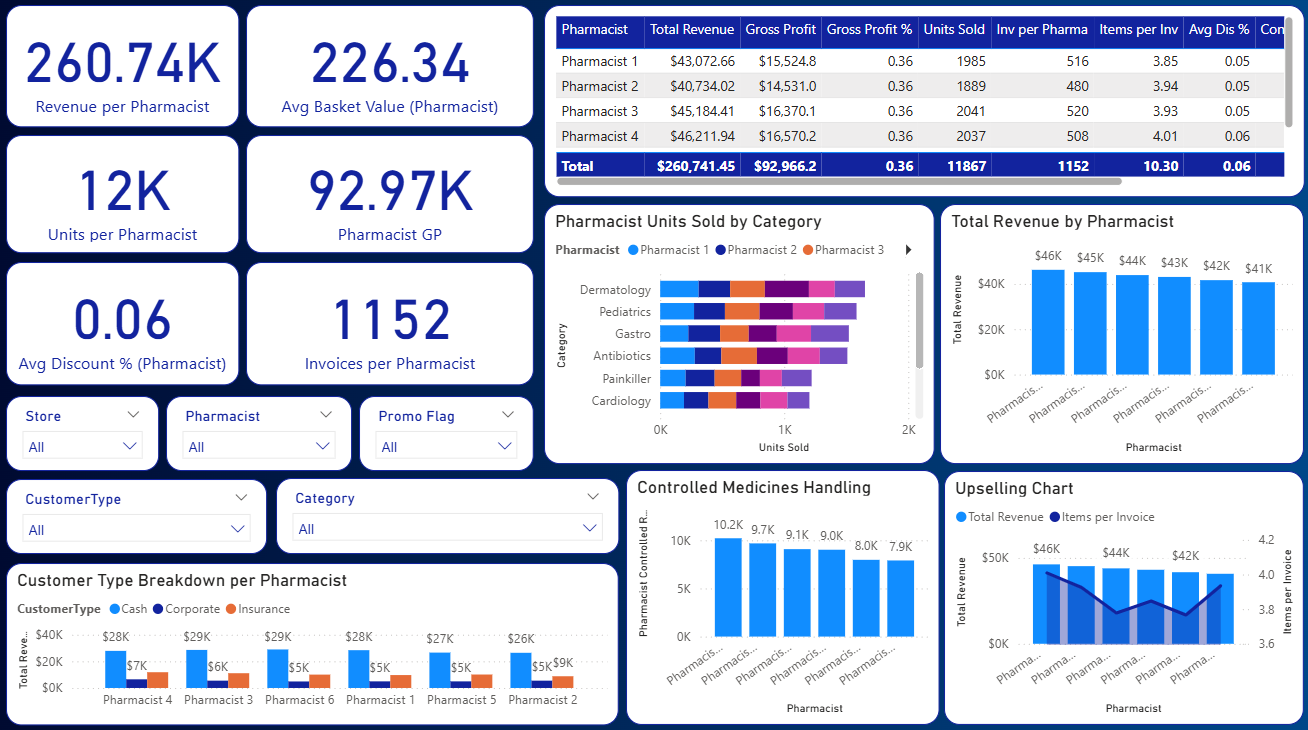
Real dashboards from the CODERS platform — connected to Business Central, SAP, or your existing ERP. Refreshed automatically.

app.powerbi.com/executive-overview
CODERS pharma dashboard — executive overview with revenue, gross profit, controlled revenue metrics by category
For Owners & CEOs

Executive overview

Revenue, margin, controlled revenue, and category mix — at a glance.

app.powerbi.com/pharmacist-view
CODERS pharma dashboard — operational view with per-pharmacist revenue, basket value, units sold, and upselling metrics
For Operations & Sales

Pharmacist performance view

Revenue per pharmacist, basket value, upselling, and category breakdown.

Real layout. Real data. In the demo we connect it to your ERP and walk through it live — no slides, no generic screenshots.

Ready to move forward?

Stop guessing. Start running your pharma business on data.

A 15-minute call. We show you the dashboard, you ask whatever you want, we leave you with a clear sense of what's possible. No obligation, no pitch deck.

  • Works with your existing ERP — BC, SAP, NAV, or custom
  • Live in 4–6 weeks, not 4–6 months
  • Microsoft Solutions Partner — enterprise-grade security
  • Local team — Arabic & English support